7. Women live alone more often than men
At the end of 2009, Finland had 2,517,400 household-dwelling units. A household-dwelling unit is formed by all persons living permanently at the same address. Those permanently resident in institutions do not form household-dwelling units and are not included in the household population. This applies also to persons whose dwellings do not meet the definition of a dwelling (see Concepts).
The number of household dwelling-units has grown by 18,100 from the previous year. The number grew by 4,800 less than in the year before. The numbers of one and two-person households continued to grow but now even the number of three-person household-dwelling units went up, although only by a couple of hundred. As in the previous year, the number of household-dwelling units with at least seven persons went up again but only by 65. The number of other household dwelling-units has in turn decreased.
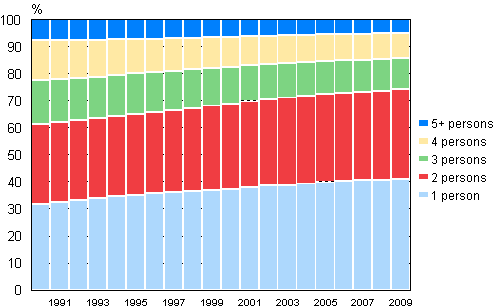
Today, the commonest household-dwelling unit consists of one person. In the 1975 population census two-person household-dwelling units were still the most numerous. By the next population census in 1980, one-person household-dwelling units had already become the most numerous. One-person household-dwelling units make up 41 per cent and two-person household-dwelling units 33 per cent of all household-dwelling units, meaning that units larger than these only account for 26 per cent.
Table 11. Household-dwelling units by the number of persons living in them in 1960–2009
| Year | Household-dwelling units | Number of persons in household-dwelling unit | Persons in household-dwelling units | Average size of household-dwelling units | ||||||
| Total | 1 | 2 | 3 | 4 | 5 | 6 | 7+ | |||
| 1960 | 1 204 385 | 188 995 | 245 921 | 229 824 | 211 473 | 141 526 | 84 147 | 102 499 | 4 396 398 | 3,34 |
| 1970 | 1 420 723 | 288 970 | 323 640 | 284 336 | 252 696 | 140 089 | 69 293 | 61 699 | 4 540 945 | 2,99 |
| 1980 | 1 781 771 | 482 476 | 457 667 | 345 769 | 313 626 | 118 678 | 40 681 | 22 874 | 4 708 299 | 2,64 |
| 1985 | 1 887 710 | 532 094 | 514 825 | 347 127 | 324 365 | 117 290 | 33 895 | 18 114 | 4 839 696 | 2,56 |
| 1990 | 2 036 732 | 646 229 | 597 928 | 332 295 | 300 429 | 112 714 | 30 596 | 16 541 | 4 927 430 | 2,42 |
| 1995 | 2 180 934 | 766 636 | 652 608 | 323 921 | 278 102 | 110 370 | 31 616 | 17 681 | 5 040 600 | 2,31 |
| 2000 | 2 295 386 | 856 746 | 722 437 | 312 646 | 254 707 | 103 339 | 29 328 | 16 183 | 5 081 354 | 2,21 |
| 2005 | 2 429 500 | 964 739 | 789 950 | 297 276 | 240 517 | 96 607 | 26 202 | 14 209 | 5 153 727 | 2,12 |
| 2006 | 2 453 826 | 983 626 | 801 068 | 294 518 | 239 413 | 95 056 | 25 882 | 14 263 | 5 172 922 | 2,11 |
| 2007 | 2 476 505 | 999 812 | 811 596 | 292 140 | 239 151 | 93 746 | 25 639 | 14 421 | 5 195 414 | 2,10 |
| 2008 | 2 499 332 | 1 014 974 | 822 639 | 290 820 | 238 628 | 92 316 | 25 408 | 14 547 | 5 219 284 | 2,09 |
| 2009 | 2 517 393 | 1 025 658 | 830 843 | 291 056 | 238 529 | 91 368 | 25 327 | 14 612 | 5 242 156 | 2,08 |
| Per cent | ||||||||||
| 1960 | 100,0 | 15,7 | 20,4 | 19,1 | 17,6 | 11,8 | 7,0 | 8,5 | - | - |
| 1970 | 100,0 | 20,3 | 22,8 | 20,0 | 17,8 | 9,9 | 4,9 | 4,3 | - | - |
| 1980 | 100,0 | 27,1 | 25,7 | 19,4 | 17,6 | 6,7 | 2,3 | 1,3 | - | - |
| 1985 | 100,0 | 28,2 | 27,3 | 18,4 | 17,2 | 6,2 | 1,8 | 1,0 | - | - |
| 1990 | 100,0 | 31,7 | 29,4 | 16,3 | 14,8 | 5,5 | 1,5 | 0,8 | - | - |
| 1995 | 100,0 | 35,2 | 29,9 | 14,9 | 12,8 | 5,1 | 1,4 | 0,8 | - | - |
| 2000 | 100,0 | 37,3 | 31,5 | 13,6 | 11,1 | 4,5 | 1,3 | 0,7 | - | - |
| 2005 | 100,0 | 39,7 | 32,5 | 12,2 | 9,9 | 4,0 | 1,1 | 0,6 | - | - |
| 2006 | 100,0 | 40,1 | 32,7 | 12,0 | 9,8 | 3,9 | 1,1 | 0,6 | - | - |
| 2007 | 100,0 | 40,4 | 32,8 | 11,8 | 9,7 | 3,8 | 1,0 | 0,6 | - | - |
| 2008 | 100,0 | 40,6 | 32,9 | 11,6 | 9,5 | 3,7 | 1,0 | 0,6 | - | - |
| 2009 | 100,0 | 40,7 | 33,0 | 11,6 | 9,5 | 3,6 | 1,0 | 0,6 | - | - |
Figure 12. Household-dwelling units by size in 1990–2009

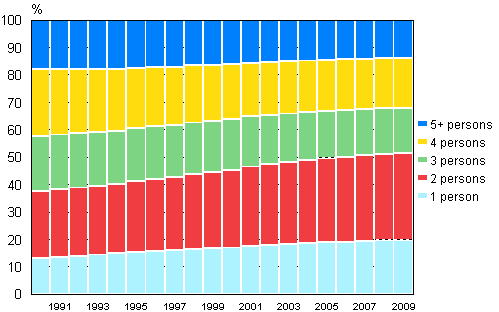
Figure 13. Household-dwelling unit population by size in 1990–2009

Household-dwelling units can also be studied from the population perspective in order to ascertain how many people in Finland live in household-dwelling units of a certain size class. The proportion of those living alone of the total population has gradually grown from 13 per cent two decades ago to 19 per cent today. The majority (31%) of the population live in two-person household-dwelling units. At least one-half of the 55 to 79-year-old population live in two-person household-dwelling units, in other words the children have flown the nest and both spouses are still alive.
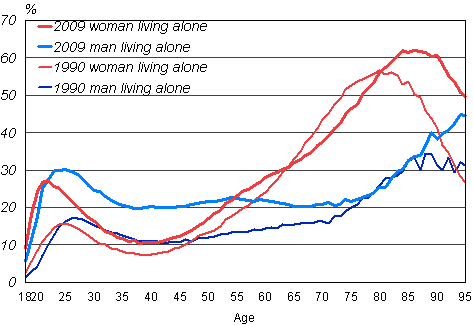
All in all, women live alone more often than men do. As in the previous year, 25 per cent of the women and 21 per cent of the men aged over 15 live alone. The gendered proportional distribution of living alone is somewhat different when examined against age. Changes are the most drastic in the lifecycle of women, who live alone when they are young and most probably again when they are old. The proportion of women living alone is the lowest when they are about 40 years old; when 10 per cent of women in this age group live alone. Like young women, young men also live alone. However, the number of men living alone does not decrease with age to as low as that of women living alone. Roughly one-fifth of the men having attained the age of 33 live alone and this proportion stays almost unchanged until the age of 75. The number of men living alone is partly explained by divorces. In a divorce, the children usually stay with the mother and the father lives alone, at least temporarily. Approximately 30 per cent of the men aged at least 80 live alone.
When comparing living alone today with the situation in 1990 we find that living alone has increased especially markedly among the youngest age groups of women and men, as well as among both old men and old women. In terms of numbers, 63-year-old women are the largest age group of those living alone.
Figure 14. Men and women living alone as a proportion of age group in 1990 and 2009

Source: Population and Cause of Death Statistics, Statistics Finland
Inquiries: Marjut Pietiläinen (09) 1734 2798, Timo Nikander (09) 1734 3250, vaesto.tilasto@stat.fi
Director in charge: Jari Tarkoma
Updated 30.11.2010
Official Statistics of Finland (OSF):
Families [e-publication].
ISSN=1798-3231. Annual Review 2009,
7. Women live alone more often than men
. Helsinki: Statistics Finland [referred: 26.4.2025].
Access method: http://stat.fi/til/perh/2009/02/perh_2009_02_2010-11-30_kat_007_en.html

