Published: 7 April 2016
Median earnings of wage and salary earners highest in densely-populated municipalities
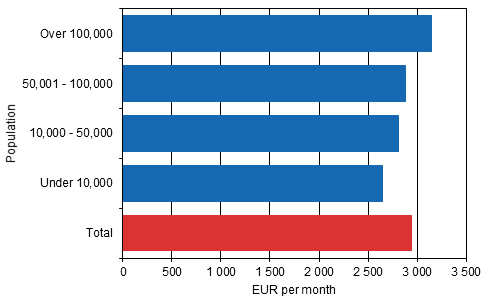
According to Statistics Finland's Structure of Earnings statistics, the size of the municipality where the workplace is located is connected to the earnings of wage and salary earners. In 2014, the median of total earnings of full-time wage and salary earners was EUR 3,143 per month when their workplace was located in a municipality of over 100,000 inhabitants. The corresponding median earnings were EUR 2,647 per month in a municipality of under 10,000 inhabitants.
Median of total earnings of full-time wage and salary earners according to the population of the municipality of where the workplace is located in 2014

Median of earnings of full-time employees EUR 2,946 per month
In 2014, the median of total earnings of full-time wage and salary earners was EUR 2,946: one-half of wage and salary earners made more than that and one half less than that. If all wage and salary earners are placed in the order of size of their pay, the pay of the midmost wage and salary earner is the median pay.
Total earnings include regular working time, overtime compensations, all bonuses and benefits in kind. Total earnings do not include one-off pay items, such as performance-based bonuses. Total earnings in the Structure of Earnings statistics are gross wages and salaries. A full-time wage and salary earner refers to a wage or salary earner who has worked a full working week during the statistical reference month.
Median earnings in management and professional tasks highest in municipalities of over 100,000 inhabitants
Around 50 per cent of the wage and salary earners in the Structure of Earnings statistics were working in municipalities of over 100,000 inhabitants. In 2014, these municipalities were Helsinki, Espoo, Tampere, Vantaa, Oulu, Turku, Jyväskylä, Lahti and Kuopio.
In the group formed of these municipalities of over 100,000 inhabitants, the median of total earnings was highest in five main groups of the Classification of Occupations (AML 2010). These groups were managers, professionals, technicians and associate professionals, clerical support workers, and service and sales workers.
Correspondingly, in the group formed of municipalities of under 10,000 inhabitants, the median of total earnings was lowest in all main groups of the Classification of Occupations, except for the group of skilled agricultural, forestry and fishery workers.
The connection of the size of the workplace municipality to median earnings was highest in management and professional tasks. The median earnings of managers were EUR 6,166 per month in municipalities of over 100,000 inhabitants and EUR 4,592 in municipalities of under 10,000 inhabitants. The median earnings of managers were thus 34 per cent higher in municipalities of over 100,000 inhabitants than in municipalities of under 10,000 inhabitants. The corresponding difference for professionals was 16 per cent and for technicians and associate professionals 13 per cent.
For clerical support workers, the difference in median earnings between the biggest and smallest municipality workplace groups was eight per cent. The corresponding difference for service and sales workers was two per cent.
The difference was smallest in median earnings in the occupational group of elementary occupations, where the difference between municipalities of over 100,000 inhabitants and under 10,000 inhabitants was around one per cent. The occupational group includes cleaning workers and other assisting workers in different fields.
If municipalities of over 100,000 inhabitants in Uusimaa, that is, Helsinki, Espoo and Vantaa, were removed from the examination, the median earnings would be even higher in large than small municipalities in nearly all main groups of the Classification of Occupations.
Median of total earnings of full-time wage and salary earners by the main group of the Classification of Occupations (AML 2010) and the population of the municipality where the workplace is located in 2014
| Classification of Occupations 2010 | Population | |||
| Over 100,000 | 50,001—100,000 | 10,000–50,000 | Under 10,000 | |
| 1 Managers | 6 166 | 5 107 | 4 956 | 4 592 |
| 2 Professionals | 4 104 | 3 790 | 3 657 | 3 547 |
| 3 Technicians and associate professionals | 3 242 | 2 978 | 3 013 | 2 866 |
| 4 Clerical support workers | 2 631 | 2 490 | 2 478 | 2 447 |
| 5 Service and sales workers | 2 386 | 2 383 | 2 350 | 2 339 |
| 6 Skilled agricultural, forestry and fishery workers | 2 416 | 2 365 | 2 332 | 2 429 |
| 7 Craft and related trades workers | 2 937 | 2 891 | 2 848 | 2 651 |
| 8 Plant and machine operators, and assemblers | 2 882 | 2 958 | 2 925 | 2 652 |
| 9 Elementary occupations | 2 140 | 2 134 | 2 185 | 2 118 |
| Total | 3 143 | 2 877 | 2 812 | 2 647 |
Size of the workplace municipality has more effect on earnings in the private sector
When examining median earnings on the most detailed level of the Classification of Occupations, interesting differences can be seen. In general terms, the differences in median earnings are big in those occupational groups where the majority of wage and salary earners work in the private sector. Correspondingly, the connection between median earnings and the size of the workplace municipality is weaker in occupational groups concentrating in the public sector.
For example, the median earnings of finance managers were EUR 6,735 per month in the biggest municipalities, while in the smallest municipalities the median for finance managers was EUR 4,770 per month. Mechanical engineers and credit and loans officers mainly working in the private sector earned, on average, more in large than small municipalities.
In occupations where the majority of wage and salary earners work in the local government sector, the size of the workplace municipality has not an equally clear connection to the earnings level. Child care services managers and psychologists earned slightly more in big than small municipalities. The median of total earnings of early childhood educators was in turn at its highest in municipalities of under 10,000 inhabitants.
There are occupational groups in service industries where the median earnings are higher in small than larger municipalities. The median earnings of cooks and food service counter attendants were highest when they were working in municipalities of under 10,000 inhabitants. Office cleaners had the highest median earnings in municipalities with 10,000 to 50,000 inhabitants.
The median earnings of general medical practitioners were 16 per cent higher in municipalities of under 10,000 inhabitants than in municipalities of over 100,000 inhabitants. When working in smaller municipalities, general medical practitioners earn clearly more working time-related allowances, but on the whole, the difference in median earnings is not explained by premium pay. The age distribution of general medical practitioners does not explain the difference either.
It is not possible to take a comprehensive stand on pay differentials between municipalities of different size based on the Structure of Earnings statistics: the statistics do not include data on personal premium pay or pay groups. Differences in earnings may also be related to work performance, experience or other factors with an effect on remuneration.
Median of total earnings of full-time wage and salary earners in certain occupational groups (AML 2010) and the population of the municipality where the workplace is located in 2014
| Classification of Occupations 2010 | Population | |||
| Over 100,000 | 50,001—100,000 | 10,000–50,000 | Under 10,000 | |
| 1211 Finance managers | 6 735 | 5 306 | 5 509 | 4 770 |
| 1341 Child care service managers | 3 347 | 3 239 | 3 208 | 3 124 |
| 2144 Mechanical engineers | 4 466 | 4 083 | 4 239 | 3 940 |
| 2211 General medical practioners | 5 898 | 6 388 | 6 670 | 6 837 |
| 2342 Early childhood educators | 2 558 | 2 569 | 2 597 | 2 601 |
| 2634 Psychologists | 3 563 | 3 653 | 3 560 | 3 555 |
| 3255 Physiotherapists, etc | 2 627 | 2 582 | 2 588 | 2 569 |
| 3312 Credit and loan experts | 4 604 | 4 140 | 4 279 | 3 989 |
| 4411 Library clerks | 2 540 | 2 524 | 2 533 | 2 518 |
| 4313 Payroll clerks | 2 373 | 2 259 | 2 234 | 2 228 |
| 51201 Cooks | 2 160 | 2 171 | 2 185 | 2 202 |
| 5246 Food service counter attendants | 1 897 | 1 895 | 1 932 | 1 994 |
| 7411 Building and related electricians | 3 133 | 3 063 | 3 035 | 2 943 |
| 8160 Food and related products machine operators | 2 830 | 2 721 | 2 731 | 2 524 |
| 91121 Office cleaners, etc. | 1 900 | 1 949 | 1 975 | 1 984 |
Big municipalities have a different occupational structure than small municipalities
The mean and median of total earnings of full-time employees are the higher the bigger the workplace municipality is. This is caused first of all by that earnings are higher, on average, in large municipalities in the same occupational groups. Another factor influencing pay differential is the occupational structure differing according to municipality size.
For instance, there are relatively more professionals and technicians and associate professionals – who typically earn more than other wage and salary earners – in large than small municipalities. In municipalities of over 100,000 inhabitants, around 50 per cent of full-time wage and salary earners worked as professionals or associate professionals, while the corresponding figure was around 30 per cent in municipalities of under 10,000 inhabitants.
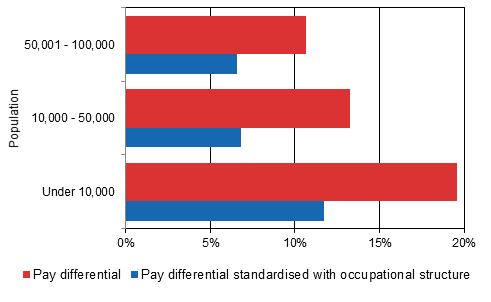
What would mean earnings look like in small municipalities if their occupational structure was similar to that in municipalities of over 100,000 inhabitants? The figure below answers this question. There the occupational structure of municipality size groups is standardised in accordance with the occupational structure of municipalities of over 100,000 inhabitants on the most detailed level of the Classification of Occupations (AML 2010). Around 500 occupational groups were taken into consideration in the standardisation.
Pay differential by the size of workplace location compared to municipalities of over 100,000 inhabitants in 2014

In 2014, the difference in the mean earnings of full-time wage and salary earners was around 20 per cent between a municipality of over 100,000 inhabitants and a municipality of 10,000 inhabitants. When the occupational structure is standardised, the difference lowers to 12 per cent.
Median earnings clearly higher in Uusimaa than in the rest of the country
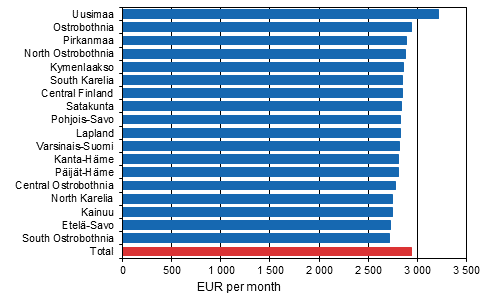
In 2014, the median of total earnings of full-time wage and salary earners was EUR 3,217 per month in Uusimaa. Median earnings did not go beyond EUR 3,000 per month in any other region.
The median of total earnings was lowest in Etelä-Savo (EUR 2,731) and in South Ostrobothnia (EUR 2,717).
Differences between regions are partly caused by the occupational structure. For example, more managers, professionals and associate professionals are working in Uusimaa than in the rest of the country. In these occupational groups, the earnings level is, on average, higher than in the other occupational groups.
Median of total earnings of full-time wage and salary earners by region in 2014

The Structure of Earnings statistics for 2014 provide data on the earnings of around 1.6 million full time and part time wage and salary earners. The data in the statistics are collected from monthly-paid wage and salary earners for September, October or November, and from hourly-paid wage and salary earners for the last quarter of the year. The statistics for 2014 were supplemented with the Tax Administration's Palkka.fi data, see Changes in these statistics.
Apart from earnings for regular working hours, total earnings also include pay for any possible overtime and working hour supplements, premium pays, supplement for location and adverse working conditions, supplements based on duties, professional skill and years of service, performance-based pay components, compensation for standby and on-call work, pay paid for hours not worked and benefits in kind. Total earnings do not include one-off pay items, such as performance-based and holiday bonuses.
Source: Structure of Earnings 2014, Statistics Finland
Inquiries: Sampo Pehkonen 029 551 3452, Jukka Pitkäjärvi 029 551 3356, palkkarakenne@stat.fi
Director in charge: Mari Ylä-Jarkko
Publication in pdf-format (240.4 kB)
- Tables
-
Tables in databases
Pick the data you need into tables, view the data as graphs, or download the data for your use.
Appendix tables
Updated 7.4.2016
Official Statistics of Finland (OSF):
Structure of Earnings [e-publication].
ISSN=1799-0092. 2014. Helsinki: Statistics Finland [referred: 19.4.2025].
Access method: http://stat.fi/til/pra/2014/pra_2014_2016-04-07_tie_001_en.html

