Published: 7 March 2019
Earnings of wage and salary earners highest in the most populated municipalities
According to Statistics Finland's Structure of Earnings statistics, the size of the municipality where the workplace is located was connected to the earnings of wage and salary earners in 2017. When the workplace is located in a municipality with over 200,000 inhabitants, the median of total earnings was EUR 19.1 per hour paid. Correspondingly, median earnings were EUR 15.8 in municipalities with under 10,000 inhabitants.
Median of total hourly earnings of wage and salary earners according to the size of workplace location in 2017
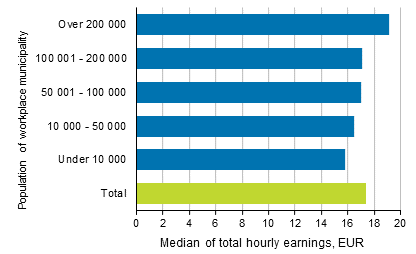
On the level of the whole country, the median of total hourly earnings for full- and part-time employees was EUR 17.4. In 2017, one-half of wage and salary earners earned less per hour paid, one half more than this.
Besides basic pay and scheduled pay, total earnings include all bonuses, overtime pay and benefits in kind. Total earnings are in gross, so taxes or other payments have not been subtracted from them.
Total hourly earnings are defined by dividing wage and salary earners’ total monthly earnings by regular weekly working hours and hours of extra and overtime work. Regular weekly working hours are not based on hours worked, but on hours for which pay has been paid. Therefore, short sickness absences or unpaid overtime work have no effect on regular working hours.
The Structure of Earnings statistics describe wage and salary earners working in enterprises with more than five employees in the public and private sectors. In the statistics it can be seen that the connection remains between the municipality where the workplace is located and median earnings even if earnings are examined only in the private sector.
Most professional work in largest municipalities
According to the Structure of Earnings statistics, the share of manager and professional occupations grows by municipality size. In municipalities with over 200,000 inhabitants, which in 2017 were Helsinki, Espoo, Tampere, Vantaa and Oulu, 62 per cent of wage and salary earners worked in manager and professional tasks.
Total hourly earnings in manager and professional occupations are typically higher than in other occupational groups.
Percentage shares of occupational groups by size of workplace location in 2017
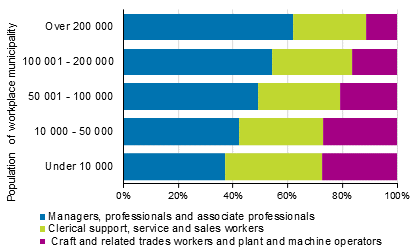
The relative number of clerical support, service and sales workers was at its highest in smaller municipalities. The share of craft and related trades workers and plant and machine operators was biggest in municipalities with under 10,000 inhabitants and 10,000 to 50,000 inhabitants, where they accounted for 27 per cent of wage and salary earners. Plant and machine operators in practice work in industrial production.
Most highly educated persons work in large municipalities
According to the data of the employment statistics for 2016, the share of highly educated wage and salary earners grows when the size of the workplace municipality increases.
When the number of inhabitants in the municipality is between 1,000 and 10,000, typically 10 to 20 per cent of all wage and salary earners were highly educated, that is, have at least university of applied sciences degrees or lower university degrees.
In Finland's two municipalities with the biggest population, Helsinki and Espoo, 41 per cent of wage and salary earners were highly educated.
Employment statistics: Share of highly educated wage and salary earners by size of workplace location in 2016
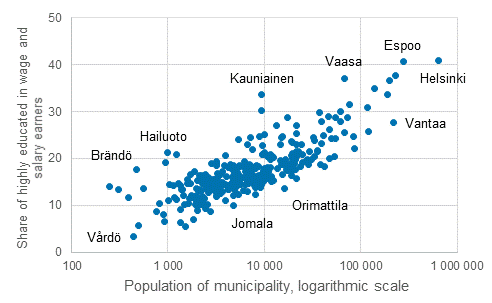
In the figure above, each point represents a Finnish municipality. The population of municipalities is shown on a logarithmic, that is, relative scale. In the figure's logarithmic scale the distance from one hundred to one thousand is as long as from one thousand to ten thousand.
Earnings of highly educated grow by municipality size
In 2017, the median of total earnings of highly educated wage and salary earners, that is, those with at least university of applied sciences degrees or lower university degrees was EUR 23.3 when the workplace was located in a municipality with over 200,000 inhabitants. The corresponding median earnings were EUR 19.6 in municipalities of under 10,000 inhabitants.
The most common occupations of highly educated in the largest municipalities were nurses, software developers and accounting associate professionals. In the smallest municipalities the most common occupations were nurses and teachers.
Total hourly earnings of wage and salary earners with university level degrees by size of workplace location in 2017
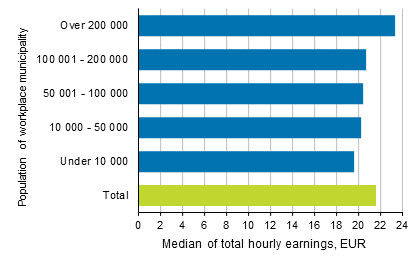
According to the employment statistics data for 2016, wage and salary earners with university level degrees work more or less as probably in manager or professional occupations in small and large municipalities. Despite this, wage and salary earners with Master's or higher university of applied sciences degrees in the same field earned more when working in large municipalities.
Median of total hourly earnings of wage and salary earners with higher university level degrees by field of education and size of workplace location in 2017
| Field of education | Under 10 000 | 50 001 — 100 000 | Over 200 000 |
| Education | 21,5 | 21,7 | 21,2 |
| Arts and humanities | 21,7 | 21,8 | 21,4 |
| Social sciences, journalism and information | 22,1 | 22,2 | 24,3 |
| Business, administration and law | 24,4 | 25,7 | 30,8 |
| Natural sciences, mathematics and statistics | 22,3 | 23,2 | 23,7 |
| Information and communcation technologies | 24,3 | 24,8 | 28,9 |
| Engineering, manufacturing and construction | 25,8 | 26,4 | 28,3 |
| Health and welfare | 28,9 | 31,8 | 29,1 |
The median earnings of wage and salary earners with higher university level degrees were higher in large municipalities particularly in the fields of business, information and communication technologies and technology. In the fields of education and humanities, the size of workplace municipality was not connected to median earnings. Those who graduated from these fields typically worked in the local government sector in 2017, as teachers, for example
The majority of those with higher university level degrees in the field of health and welfare work as doctors. Doctors’ median earnings were at their highest in municipalities of 50,000 to 100,000 inhabitants.
In other levels of education, the median of wage and salary earners’ total hourly earnings also rise when the size of the workplace location grows.
Earnings differences are not totally explained by the occupational or educational structure
What would differences in earnings between municipalities look like if their occupational structure was similar to that in municipalities of over 200,000 inhabitants? And do wage and salary earners who had completed more profitable degrees get selected into larger municipalities?
The figure below illustrates the matter. There the occupational and qualification structure of wage and salary earners is standardised according to the occupational and qualification structure of municipalities with over 200,000 inhabitants. The standardisation was made on the most detailed level of the Classification of Occupations 2010 and the classification of qualifications. The classification of qualifications takes account of both the level and field of education.
Connection of size of workplace location to the average of total hourly earnings compared with municipalities of over 200,000 inhabitants in 2017
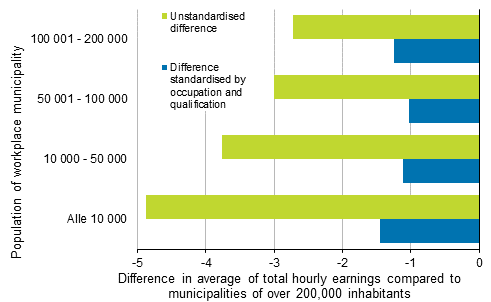
In the figure it can be seen that the difference of nearly EUR five in the average of total hourly earnings between municipalities with over 200,000 inhabitants and municipalities with under 10,000 inhabitants contracts to around EUR 1.5, when the differences in the occupational and qualification structure are taken into consideration. In other municipality size categories, consideration to the occupational and qualification structure also diminishes the difference of hourly earnings relative to municipalities of over 200,000 inhabitants.
Therefore, part of the earnings differences in municipalities of different sizes is explained by more wage and salary earners working in better paid occupations in large municipalities. Also, the fact that in large municipalities the qualification structure of wage and salary earners differs from that in small municipalities has a minor effect on explaining earnings differences.
Source: Structure of Earnings 2017, Statistics Finland
Inquiries: Sampo Pehkonen 029 551 3452, Jukka Pitkäjärvi 029 551 3356, palkkarakenne@stat.fi
Director in charge: Mari Ylä-Jarkko
Publication in pdf-format (249.4 kB)
- Tables
-
Tables in databases
Pick the data you need into tables, view the data as graphs, or download the data for your use.
Appendix tables
Updated 7.3.2019
Official Statistics of Finland (OSF):
Structure of Earnings [e-publication].
ISSN=1799-0092. 2017. Helsinki: Statistics Finland [referred: 19.4.2025].
Access method: http://stat.fi/til/pra/2017/pra_2017_2019-03-07_tie_001_en.html

