Published: 20 September 2019
IT services drove the growth in international trade in services in the second quarter of 2019
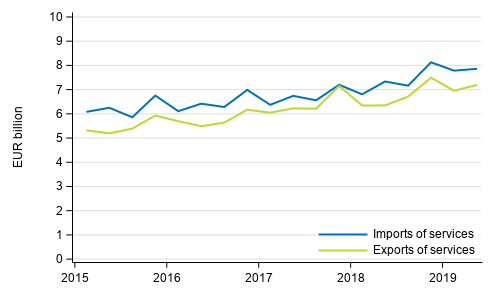
Service exports grew by 13 per cent in the second quarter of 2019 compared with the corresponding quarter of the previous year. Service imports grew by seven per cent. Export of IT services grew strongly. In imports, especially other business services grew from the corresponding quarter last year. The data appear from Statistics Finland's statistics on international trade in goods and services, which are part of balance of payments .
Figure 1. Imports and exports of services quarterly

The combined exports of goods and services grew by four per cent and imports by five per cent in the second quarter of 2019 compared with the corresponding quarter in 2018. Goods exports remained on level with the corresponding quarter of last year. By contrast, goods imports increased by four per cent.
The biggest import item was still other business services
In the second quarter of 2019, other business services represented EUR 2.8 billion of imports, which makes it the biggest import item. The share of other business services in total imports was 35 per cent. Imports of other business services grew by 24 per cent year-on-year.
Other large import items are IT services, transport and tourism services. However, the share of these items is much smaller compared to the share of other business services in total imports.
Export of IT services continued growing
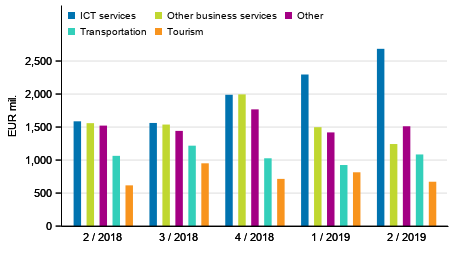
The growth in IT services was extremely strong in the second quarter of 2019. IT services is clearly the largest service export item including, e.g. hardware and software consultancy and implementation services and software programs that improve business productivity, as well as computer game programs. In all, IT services were exported to the tune of EUR 2.7 billion in the second quarter of 2019.
Figure 2. Exports of services by service item

Service exports growth particularly strong to Europe and Asia
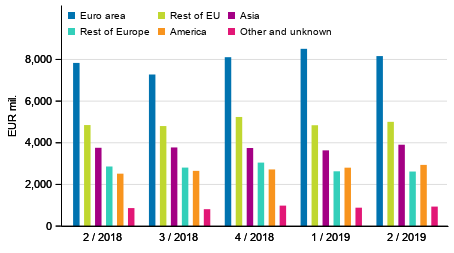
Service exports grew extensively to different continents. Service exports to Europe grew by EUR 0.4 billion from the corresponding quarter in 2018 amounting to EUR 4.5 billion. The share of Europe in Finland’s service exports was nearly two-thirds. Service exports to Asia were also strong. Services were exported to Asia for EUR 1.5 billion and growth amounted to close on EUR 0.3 billion year-on-year. Thus, service exports to Asia grew, but goods exports petered out compared to the corresponding quarter one year ago. Asia’s share in service exports was around 20 per cent in the second quarter of 2019.
Service exports to America increased moderately in the second quarter. Services were exported to America for EUR one billion. Examined by continent, America was Finland’s third largest export partner after Europe and Asia. America’s share in service exports was 14 per cent in the second quarter of 2019.
Exports to Germany decreased for both goods and services
In the second quarter of 2019, exports to Germany fell. Correspondingly, goods exports decreased throughout Europe. Germany’s share in Finland’s exports to Europe was around 13 per cent for both goods and services. The share decreased by good two percentage points compared to the corresponding quarter in 2018.
Imports from Germany also fell for goods and services from the same quarter last year. However, examined by country, most goods were imported from Germany to Finland. Goods imports from Germany was EUR 2.0 billion in the second quarter of 2019. By contrast, goods imports from Europe to Finland grew, but service imports declined. Service imports from Europe to Finland decreased slightly to EUR 5.9 billion. The growth in service imports rested on an increase in imports to Finland from America. Service imports from America amounted to EUR 0.9 billion. Compared to the corresponding quarter of last year, the increase was EUR 0.3 billion.
Sweden is still Finland’s main export partner
Sweden’s share in Finland’s service exports was 12 per cent and 13 per cent in goods exports in the second quarter of 2019. Thus, Sweden was the most important export country for Finland. The corresponding shares of the second most important country of exports, the United States, were 11 per cent in services and nine per cent in goods.
Service exports decreased slightly from one year ago, but goods exports to Sweden grew. Goods exports grew by some EUR 0.2 billion and goods were exported to Sweden for EUR 2.2 billion in the second quarter of 2019. Exports of services, in turn, amounted to EUR 0.9 billion.
Figure 3. Exports of goods and services in balance of payments terms by area

Time series revision on the data of the balance of payments and international investment position in the September 2019 release
The data of the statistics on balance of payments and international investment position have been level revised for 2006 to 2019. The main goal of the time series revision is to promote cohesion between balance of payments and international investment position and national accounts. In addition, the temporal comparability of the data has been improved and new data sources have been utilised in connection with the time series revision.
The biggest change in goods and services is directed at the treatment of so-called project deliveries. Previously the income from project deliveries were recorded as construction and project delivery exports and the costs as construction and project delivery imports. In connection with the time series revision, net recording was adopted, which decreases the levels of service exports and imports by at most EUR 1.3 billion in 2016. Another important change in recording methods that lowers the levels of exports and imports is how recordings related to international trade are made, which decreases goods exports and imports by at most EUR 0.4 billion in 2014. The above-mentioned revisions do not affect the level of net exports.
The changes that affect net exports most were directed at goods trade related to global production and weakened net exports by at most EUR 0.5 billion in 2016.
Statistics on international trade
The statistics on international trade in goods and services are part of balance of payments . The statistics comprise breakdowns of goods and services on a more detailed level. The guidelines and recommendations of the Balance of Payments Manual (BPM6) applied to balance of payments are consistent with the European System of Accounts (ESA 2010). National Accounts are published on quarterly and annual levels . Finnish Customs publishes data on goods trade across borders. Goods trade published by Finnish Customs is used as source data for the statistics on international trade in goods and services. Removals and additions caused by definitions are made to them to achieve goods trade in balance of payments terms.
Finnish Customs’ statistical service, tilastot@tulli.fi, +358 29 552 335.
Source: International trade in goods and services 2018, Statistics Finland
Inquiries: Tommi Kaatrasalo 029 551 3320, Risto Sippola 029 551 3383, globalisaatio.tilastot@stat.fi
Director in charge: Ville Vertanen
Publication in pdf-format (271.7 kB)
- Tables
-
Tables in databases
Pick the data you need into tables, view the data as graphs, or download the data for your use.
Appendix tables
- Revisions in these statistics
-
- Revisions in these statistics (20.9.2019)
Updated 20.9.2019
Official Statistics of Finland (OSF):
International trade in goods and services [e-publication].
ISSN=2343-4244. 2nd quarter 2019. Helsinki: Statistics Finland [referred: 20.4.2025].
Access method: http://stat.fi/til/tpulk/2019/02/tpulk_2019_02_2019-09-20_tie_001_en.html

