Published: 1 June 2010
Number of persons employed fixed-term decreased in 2009
According to Statistics Finland’s Labour Force Survey, the number of persons working in fixed-term employment relationships decreased in 2009. Fixed-term employment contracts decreased most in manufacturing. The number of persons doing hired work was also lower in 2009 than in the previous year. These data derive from the annual Labour Force Survey review Employment relationships and working hours in 2009.
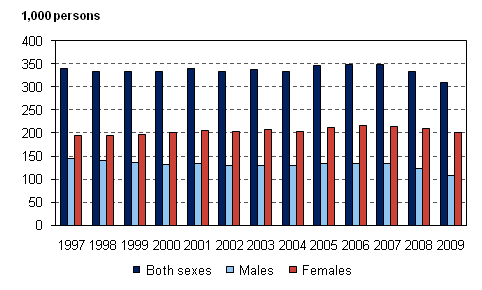
Number of fixed-term employees aged 15–74 by sex in 1997–2009

The general worsening of the employment situation in 2009 was also reflected in fixed-term employment relationships. A total of 310,000 employees worked in fixed-term employment relationships in 2009. Their number was 22,000 lower than one year earlier. The number of employees with fixed-term contracts was the lowest ever since 1997, or the starting year of a fully comparable times series.
Fifteen per cent all employees were employed fixed-term in 2009. The share of fixed-term employees was around 18 per cent among female employees and around 11 per cent among male employees.
Fixed-term employment relationships decreased mainly in the private sector, whereas in the public sector their number remained almost unchanged. Fixed-term employment relationships diminished most in manufacturing where the number of employees with fixed-term contracts was 12,000 lower in 2009 than in the previous year.
The number of persons doing hired work also fell in 2009, when they numbered 23,000, or around one per cent of all employees.
Links
Updated tables of the Labour Force Survey: http://tilastokeskus.fi/til/tyti/tau_en.html .
The first annual Labour Force Survey review, Employment and unemployment in 2009 , takes an overview of changes in employment in 2009.
Source: Labour force survey 2009. Statistics Finland
Inquiries: Anna Pärnänen (09) 1734 2607, Päivi Keinänen (09) 1734 3416, tyovoimatutkimus@stat.fi
Director in charge: Riitta Harala
Publication in pdf-format (561.6 kB)
- Reviews
-
- 1. Fixed-term employment relationships decreased in 2009 (1.6.2010)
- 2. Number of persons employed part-time has remained almost unchanged (1.6.2010)
- 3. Number of hired workers decreased (1.6.2010)
- 4. Women most often in supervisory posts in the local government sector (1.6.2010)
- 5. Working hours (1.6.2010)
- Tables
-
Tables in databases
Pick the data you need into tables, view the data as graphs, or download the data for your use.
Appendix tables
- Appendix table 1. Temporary employees (fixed-term job) by age and sex in 2007 - 2009 (1.6.2010)
- Appendix table 2. Temporary employees (fixed-term job) aged 15-74 by employer sector and sex in 2007 - 2009 (1.6.2010)
- Appendix table 3. Temporary employees (fixed-term job) aged 15-74 by industry (TOL 2008) in 2007 - 2009 (1.6.2010)
- Appendix table 4. Temporary employees (fixed-term job) aged 15-74 by reason for fixed-term employment in 2008 - 2009, % (1.6.2010)
- Appendix table 5. Part-time employed persons by age and sex in 2007 - 2009 (1.6.2010)
- Appendix table 6. Part-time employees by age and sex in 2007 - 2009 (1.6.2010)
- Appendix table 7. Part-time employed persons aged 15-74 by employer sector and sex in 2007 - 2009 (1.6.2010)
- Appendix table 8. Part-time employees aged 15-74 by employer sector and sex in 2007 - 2009 (1.6.2010)
- Appendix table 9. Part-time employed persons aged 15-74 by industry (TOL 2008) in 2007 - 2009 (1.6.2010)
- Appendix table 10. Part-time employees aged 15-74 by industry (TOL 2008) in 2007 - 2009 (1.6.2010)
- Appendix table 11. Part-time employed persons aged 15-74 by sex and reason for part-time employment in 2008 - 2009 (1.6.2010)
- Appendix table 12. Part-time employees aged 15-74 by sex and reason for part-time employment in 2008 - 2009 (1.6.2010)
- Appendix table 13. Employees in hired work by age and sex in 2008 - 2009 (1.6.2010)
- Appendix table 14. Employed persons aged 15-74 by regular weekly working hours in main job, socio-economic group and sex in 2009 (1.6.2010)
- Appendix table 15. Employees aged 15-74 by regular weekly working hours in main job, employer sector and socio-economic group in 2009 (1.6.2010)
- Appendix table 16. Male employees aged 15-74 by regular weekly working hours in main job, employer sector and socio-economic group in 2009 (1.6.2010)
- Appendix table 17. Female employees aged 15-74 by regular weekly working hours in main job, employer sector and socio-economic group in 2009 (1.6.2010)
- Appendix table 18. Employed persons aged 15-74 by regular weekly working hours in main job and industry (TOL 2008) in 2009 (1.6.2010)
- Appendix table 19. Employees aged 15-74 by regular weekly working hours in main job and industry (TOL 2008) in 2009 (1.6.2010)
- Appendix table 20. Average regular weekly working hours in main job of employees aged 15-74 by occupation (Occupational Classification 2001) and sex in 2009 (1.6.2010)
- Appendix table 21. Average regular weekly working hours in main job of full-time employees aged 15-74 by occupation (Occupational Classification 2001) and sex in 2009 (1.6.2010)
- Appendix table 22. Average regular weekly working hours in main job of part-time employees aged 15-74 by occupation (Occupational Classification 2001) and sex in 2009 (1.6.2010)
- Notes to the tables (1.6.2010)
- Quality descriptions
-
- Quality Description: Labour force survey (1.6.2010)
Updated 1.6.2010
Official Statistics of Finland (OSF):
Labour force survey [e-publication].
ISSN=1798-7857. 15 2009. Helsinki: Statistics Finland [referred: 19.4.2025].
Access method: http://stat.fi/til/tyti/2009/15/tyti_2009_15_2010-06-01_tie_001_en.html

