Published: 29 March 2019
Population growth smallest since 1970
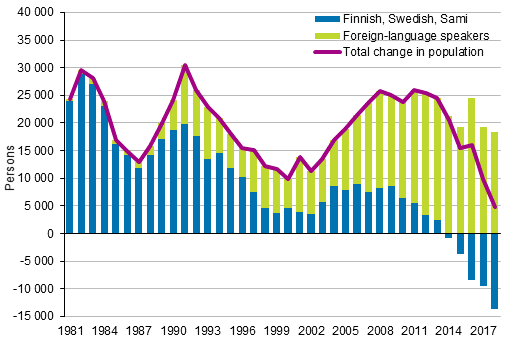
According to Statistics Finland's statistics on population structure, the official total population of Finland at the end of 2018 was 5,517,919. In the course of 2018, Finland’s population grew by 4,789 persons. Population growth was smallest since 1970. In the past five years, the number of persons speaking Finnish, Swedish or Sami as their native language has decreased by 36,029 persons. At the same time, the number of foreign-language speakers has increased by 102,678 persons.
Change in the population by native language in 1981 to 2018

Population grew in five regions
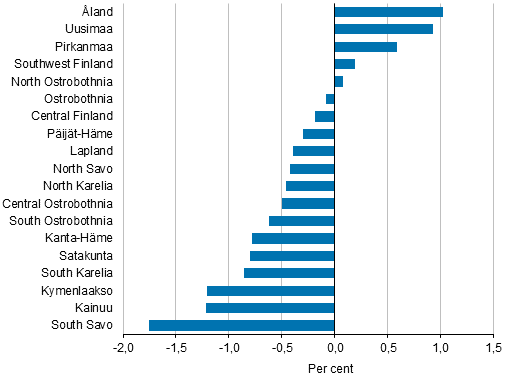
During 2018, the population grew in five regions and diminished in 14 regions. In absolute numbers, the population grew most in Uusimaa, by 15,400 persons, in Pirkanmaa, by 3,014 persons, and in Varsinais-Suomi, by 905. The relative population increase in Mainland Finland was also highest in Uusimaa, 0.9 per cent.
The biggest absolute decrease in population was seen in South Savo (2,579 persons) and Kymenlaakso (2,123 persons). In relative numbers, the population also decreased most in Kymenlaakso and South Savo (by 1.8 per cent). The population decreased most in nearly 50 years in the regions of South Karelia, South Savo, Kanta-Häme, Päijät-Häme and Satakunta.
Population change by region 2018

Vantaa grew most, Savonlinna and Kouvola lost over one thousand inhabitants
During 2018, the population grew in 61 municipalities and diminished in 248 municipalities. The biggest absolute increase in population was seen in Vantaa, 5,139 persons, in Helsinki (4,770) and Espoo (4,588). Foreign-language speakers accounted for three-quarters of the population growth in the Helsinki region.
Examined in relative terms, the population grew in Mainland Finland most in Vantaa (2.3 per cent) and Kempele (2.2 per cent). In absolute numbers, the population decreased most in Savonlinna, by 1,053 persons, and in Kouvola, by 1,019 persons. In Mainland Finland, the largest relative decreases in population occurred in Lestijärvi (6.6 per cent), Karijoki (4.1 per cent) and Kannonkoski (3.9 per cent).
Proportion of foreign-language speakers seven per cent in total population, one fifth in Vantaa
A total of 391,746 persons speaking a foreign language as their native language were living permanently in Finland at the end of 2018. The proportion of foreign-language speakers in the total population is now seven per cent. The biggest foreign-language speaking groups were Russian speakers, 79,225 persons, Estonian speakers, 49,691, and Arabic speakers, 29,462.
Examined by region, the share of foreign-language speakers was at the end of 2018 highest in the region of Uusimaa, 13 per cent of the population, and lowest in South Ostrobothnia, two per cent. Examined by municipality, the share of foreign-language speakers among the population was highest in Vantaa, 19 per cent, in Espoo, 17 per cent, and in Helsinki, 16 per cent.
Demographic dependency ratio highest in South Savo, lowest in Uusimaa
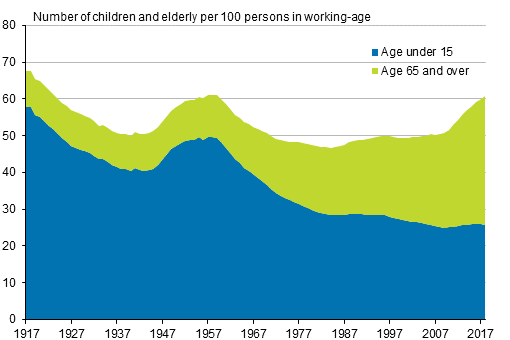
At the end of 2018, there were 882,234 persons aged under 15 in Finland and 3,430,848 persons aged between 15 and 64. Persons aged 65 or over numbered 1,204,837 at the end of 2018. The demographic dependency ratio or the number of those aged 15 or under and 65 or over per 100 working age persons, was 60.8. The demographic dependency ratio was last higher than this in 1959. During our independence, the demographic dependency ratio was at its highest in 1917 (67.6) and at its lowest in 1984 (46.7).
Examined by area, the demographic dependency ratio was highest in the regions of South Savo, 75.0, and Central Ostrobothnia, 71.6. The demographic dependency ratio was lowest in the region of Uusimaa, 51.5.
Examined by municipality, the demographic dependency ration was highest in Luhanka (106.1) and in Kuhmoinen and Hailuoto (105.1). The dependency ratio was lowest in Helsinki (45.6) and Tampere (48.4).
Demographic dependency ratio in 1917–2018

Source: Population Structure 2018, Statistics Finland
Inquiries: Markus Rapo 029 551 3238, info@stat.fi
Director in charge: Jari Tarkoma
Publication in pdf-format (328.2 kB)
- Tables
-
Tables in databases
Pick the data you need into tables, view the data as graphs, or download the data for your use.
Appendix tables
- Figures
- Quality descriptions
-
- Quality description: Population structure 2018 (29.3.2019)
Updated 29.03.2019
Official Statistics of Finland (OSF):
Population structure [e-publication].
ISSN=1797-5395. 2018. Helsinki: Statistics Finland [referred: 19.4.2025].
Access method: http://stat.fi/til/vaerak/2018/vaerak_2018_2019-03-29_tie_001_en.html

