Published: 4 December 2013
Last year persons aged between 35 and 39 had the highest level of education
By the end of 2012, a total of 3,107,062 persons in Finland had attained post-comprehensive level educational qualifications in upper secondary general school education, vocational education, polytechnic education or university education. In other words, 69 per cent of the population aged 15 or over had completed a post-comprehensive level qualification. The share of population with educational qualifications increased by one per cent from the year before.
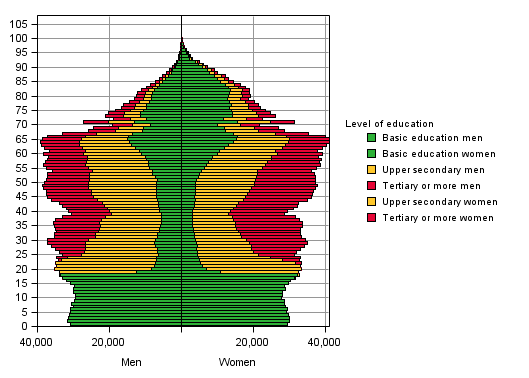
Population by level of education, age and gender 2012

In 2012, women were still more highly educated than men; the differences in education are particularly visible in the younger age groups. Of women belonging to the age group 35 to 39, 55 per cent had completed tertiary level education, while the corresponding proportion for men was 36 per cent. Correspondingly, of women aged 30 to 34, 10 per cent had completed only the basic level of education and of men 17 per cent. The differences in education are not as clear in older age groups. In the age group 60 to 64, 27 per cent of both men and women had completed tertiary level qualifications.
Altogether, 37 per cent of women and 43 per cent of men had completed upper secondary level qualifications. Overall, 32 per cent of women and 25 per cent of men had completed tertiary level qualifications. Measured by the population's level of education indicator, women's theoretical duration of education after completion of comprehensive school education was 3.5 years, while the corresponding figure for women was 3.3 years.
Of the population with a degree or a qualification, 29.9 per cent had completed an education in the field of technology, which is clearly the highest proportion ahead of the field of business and social sciences, where 18.9 per cent had completed a degree or a qualification. Altogether, 51.9 per cent of men had completed an education in the field of technology, while only 9.3 per cent of women had done the same. The most popular fields of education for women were the field of business and social sciences, 24.7 per cent and the field of health and welfare, 23.6 per cent. The changes in the shares of different fields of education have been low over the past 25 years. Since 1987, the share of the field of technology among all degrees or qualifications has decreased, while the share of the field of health and welfare has increased. In 1987, 33.5 per cent of all degrees or qualifications were in the field of technology, which indicates a drop of 3.6 percentage points by 2012. The share of the field of health and welfare has grown by four percentage points in total and by 6.1 percentage points for women.
Shares of fields of education by gender 2012
| Both genders | Men | Women | ||||
| Percentage year 2012 | Change in the share of the field since 1987 percentage points | Percentage year 2012 | Change in the share of the field since 1987 percentage points | Percentage year 2012 | Change in the share of the field since 1987 percentage points | |
| General Education | 10.5 | -1.5 | 11.0 | 0.5 | 10.0 | -3.5 |
| Teacher education and educational sciences | 3.0 | -0.1 | 1.4 | -0.3 | 4.5 | 0.0 |
| Humanities and Arts | 5.0 | 2.1 | 3.0 | 1.2 | 6.8 | 2.7 |
| Social sciences and Business | 18.9 | 1.1 | 12.7 | 1.0 | 24.7 | 0.8 |
| Natural Sciences | 2.4 | 1.0 | 2.8 | 1.2 | 1.9 | 0.7 |
| Technology | 29.9 | -3.6 | 51.9 | -3.2 | 9.3 | -2.7 |
| Agriculture and forestry | 4.4 | -2.0 | 6.1 | -3.2 | 2.9 | -0.6 |
| Health and Welfare | 13.8 | 4.0 | 3.2 | 1.1 | 23.6 | 6.1 |
| Services | 12.2 | -0.9 | 7.8 | 1.5 | 16.2 | -3.6 |
| Other or Unknown Field | 0.1 | 0.1 | 0.1 | 0.1 | 0.1 | 0.1 |
| Total | 100.0 | 100.0 | 100.0 | |||
Of the population aged 15 or over, 15 per cent lived in rural areas. Of the population living in rural areas, 36 per cent had only completed the basic level of education and 20 per cent had completed tertiary level qualifications. Measured both by the level of education indicator and by the share of population with qualifications, Kauniainen had the population with the highest educational qualifications. A person living in Kauniainen had, on average, completed 5.7 years of education after basic level education, which was one year more than in Espoo, which had the second-highest level of education. Pirkkala and Tampere were the only municipalities in Mainland Finland where, measured by the level of education indicator, men were more educated than women.
Source: Education 2013. Statistics Finland
Inquiries: Mika Witting 09 1734 3571, koulutustilastot@stat.fi
Director in charge: Riitta Harala
Publication in pdf-format (257.5 kB)
- Tables
-
Tables in databases
Pick the data you need into tables, view the data as graphs, or download the data for your use.
Appendix tables
- Figures
Updated 4.12.2013
Official Statistics of Finland (OSF):
Educational structure of population [e-publication].
ISSN=2242-2919. 2012. Helsinki: Statistics Finland [referred: 26.4.2025].
Access method: http://stat.fi/til/vkour/2012/vkour_2012_2013-12-04_tie_001_en.html

