Published: 3 November 2016
Educational qualifications highest among persons aged 40 to 44 in 2015
By the end of 2015, altogether 3,245,724 persons, or 71 per cent of the population aged 15 or over had completed a post-comprehensive level qualification. The increase from the year before was one per cent. Educational qualifications were highest among persons aged 40 to 44, of whom 86 per cent had completed a qualification.
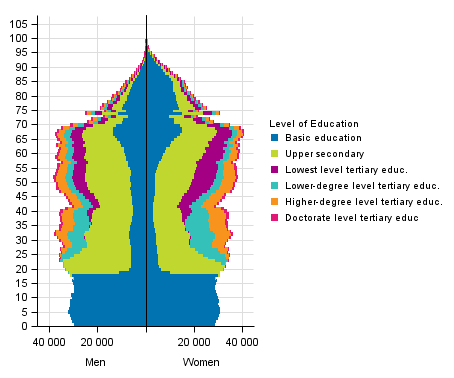
Population by level of education, age and gender 2015

In 2015, educational qualifications were highest among persons aged 40 to 44, of whom 46 per cent had attained a tertiary level qualification. In younger age groups, the share of those with tertiary level qualifications does not rise as high, so when viewing those having completed a tertiary level qualification, the rise of the population's educational level has halted. In the 35 to 39 age group, 45 per cent had completed a tertiary level qualification and in the 30 to 34 age group, 40 per cent. The halt in the rise of the educational level is a result of the gradual removal of the lowest tertiary level from the educational system. In the 40 to 44 age group, 13 per cent had completed a lowest level tertiary qualification and in the 35 to 39 age group, the corresponding share was four per cent. Completers of lowest level tertiary qualifications were almost completely absent in the 30 to 34 age group. More detailed information on levels of education can be found in Appendix table 2 and in the database tables .
In 2015, there were 115,816 persons aged 20 to 29 with only basic level of education, which is 17 per cent of the age group. Among men, 19 per cent of the age group had only basic level education and 15 per cent among women. The share of those with only basic level education was lowest at the beginning of the 2000s when the share was 16 per cent.
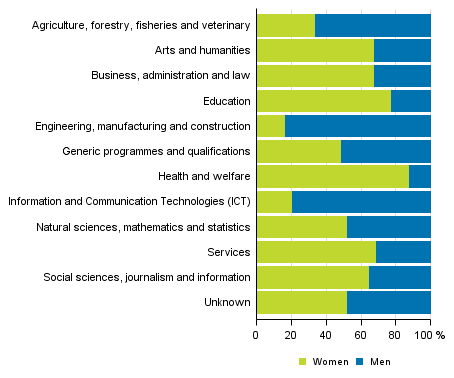
Population with educational qualification by age and field of education* 2015

*National classification of education 2016. ISCED 2011.
In 2015, fields of education were strongly segregated by gender. Male-dominated fields were agriculture and forestry, technology, data processing and telecommunications, and general education. The most distinctly male-dominated field was technology, where men made up 84 per cent of those having completed a qualification. In 2015, health and welfare was the most female-dominated field, where 88 per cent of completers of qualifications were women. Also humanities and arts, education, services and social services were clearly female-dominated fields. Women's higher level of education than men's is visible in the gender distribution of fields of education. Female-dominated fields of education are often tertiary level fields, while male-dominated fields are more focused on upper secondary level.
Educational attainmet of second level immigrants with foreign background by age 2015
| Age | Total | Basic education or less (ISCED 2 or less) | Population with educational qualifications | Upper secondary /Post-secondary non tertiary education (ISCED 3/4) | ISCED 5 or more | |||||
| % | % | % | % | % | ||||||
| Total | 11 662 | 100,0 | 7 269 | 62,3 | 4 393 | 37,7 | 3 488 | 29,9 | 905 | 7,8 |
| 15-24 | 8 965 | 100,0 | 6 431 | 71,7 | 2 534 | 28,3 | 2 474 | 27,6 | 60 | 0,7 |
| 25-34 | 558 | 100,0 | 141 | 25,3 | 417 | 74,7 | 266 | 47,7 | 151 | 27,1 |
| 35-44 | 167 | 100,0 | 29 | 17,4 | 138 | 82,6 | 69 | 41,3 | 69 | 41,3 |
| 45-54 | 156 | 100,0 | 20 | 12,8 | 136 | 87,2 | 79 | 50,6 | 57 | 36,5 |
| 55-64 | 497 | 100,0 | 110 | 22,1 | 387 | 77,9 | 211 | 42,5 | 176 | 35,4 |
| 65-74 | 914 | 100,0 | 331 | 36,2 | 583 | 63,8 | 300 | 32,8 | 283 | 31,0 |
| 75- | 405 | 100,0 | 207 | 51,1 | 198 | 48,9 | 89 | 22,0 | 109 | 26,9 |
Second generation immigrants with foreign background, i.e. those born in Finland, are mainly young people. In all, 77 per cent of second generation immigrants with foreign background belong to the age group 15 to 24, whose studying career is only beginning. The highest educated second generation immigrants with foreign background are persons aged 45 to 54, among whom 87 per cent have completed post-comprehensive level qualifications and 37 per cent tertiary level education.
Source: Education 2016. Statistics Finland
Inquiries: Mika Witting 029 551 3571, koulutustilastot@stat.fi
Director in charge: Jari Tarkoma
Publication in pdf-format (245.4 kB)
- Tables
-
Tables in databases
Pick the data you need into tables, view the data as graphs, or download the data for your use.
Appendix tables
Updated 3.11.2016
Official Statistics of Finland (OSF):
Educational structure of population [e-publication].
ISSN=2242-2919. 2015. Helsinki: Statistics Finland [referred: 19.4.2025].
Access method: http://stat.fi/til/vkour/2015/vkour_2015_2016-11-03_tie_001_en.html

