Revision of national accounts time series 2010
Statistics Finland has revised its national accounts time series for the 1975-2008 period. The made revisions affect nearly all transactions, industries and sectors.
The revisions have been made necessary by new data in the source statistics, changes in the calculation methods and corrections of detected errors. This report elaborates on the most significant revisions made. In addition, the data concerning 2007 and 2008 were previously based on preliminary source statistics. The data on these years will continue to be preliminary and will become "final" when supply and use tables are being compiled.
National accounts for the 2003-2006 period, as well as volume changes for the 2004-2006 period are based on product-specific supply and use tables. Product-specific supply and use tables for the 2000-2002 period will be compiled during 2010 but they will not alter the data at current prices published here.
With certain exceptions, revisions of figures at current prices have mainly also been interpreted as volume changes rather than price changes.
Output, intermediate consumption and value added
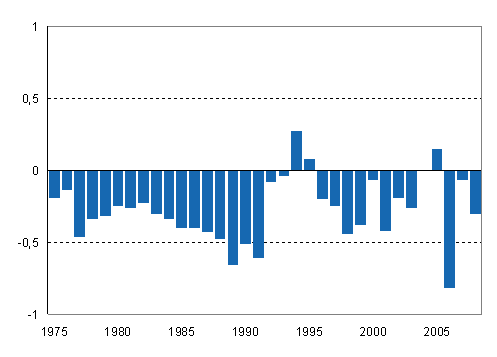
The level of both output and intermediate consumption has been raised by several per cent, at most by EUR 8-9 billion. Gross calculations were introduced in some economic activities while output or intermediate consumption were otherwise raised in some others. Compared to previous data, the level of value added and GDP fell in almost all years, GDP at most by 0.8 per cent (EUR 1.4 billion) in 2006. In other years the changes remained much smaller when expressed in euros.
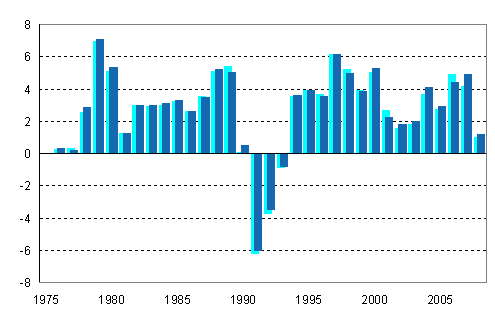
The annual change of the volume of GDP became revised at most by 0.7 percentage points in 2007 (from 4.2% to 4.9%) and by 0.5 percentage points in 2006 (from 4.9% to 4.4%).
Agriculture and forestry
Output and intermediate consumption in agriculture have been revised starting from 1975. The coverage of calculations has been improved in horticulture. Fur prices have been reviewed in certain years. Item "Other products and services" of the economic agricultural account has been broken down into components, which has influenced volume changes. Revisions in the data of the source statistics have been taken into account and detected errors have been corrected.
Compared to previous data, the level of value added of agriculture fell over the 1975-1990 period but then rose after it, at most by about EUR 200 million. Annual volume change percentages have become revised considerably, both up and downwards.
New data have become available on forestry since the reform of forest taxation in 2006. These data have lowered the output and value added of the economic activity from the past. The level differential has been gradually closed up backwards so that the old level of 1993 has been adhered to.
Forest increment has also been re-estimated starting from the year 1983 on the basis of the Finnish Forest Research Institute's new data on investments. This, in turn, has increased forestry's output and value added in the 1990s and the 2000s. On the demand side it has added to the growth of inventories, which was in fact the most significant revision made to changes of inventories.
All in all, value added of forestry has diminished by hundreds of millions of euros compared to previous data, especially in the 2000s.
Manufacturing
In the manufacture of motor vehicles and manufacture of basic metals the value of total production, and not just compensation received for contract work, has been included in output and intermediate consumption starting from the year 2000. Activity abroad has been netted out of the output and intermediate consumption of manufacture of metal products and manufacture of machinery and equipment starting from the year 2000, because it is not counted as domestic production. The changes do not affect value added.
Construction and building development
Output of building construction grew considerably for three reasons.
In August 2007, the volume index of newbuilding released revised time series starting from 1995. In them the level of output of newbuilding went up notably firstly due to risen cubic metre prices of the model buildings on which calculations are based. Secondly, building development is also now included in the new levels of newbuilding and in the output of building construction. Thirdly, even the revised statistics do not cover all new buildings as around 3-5 per cent of the data on building projects are registered late and thus left out of the statistics.
New levels of newbuilding, inclusive of data received late, have now been used in the accounts and the level differential of 1995 has been adjusted back to the old output level of 1990 to which output of building development has been added retrospectively back to 1975. The 1990-1995 level shift has been partly interpreted as growth of prices and partly as growth of volume.
Output of building development has previously been calculated as a percentage share of the value of building construction. In the new calculations it is based on the turnover of the economic activity and has contracted considerably. Intermediate consumption is also lower than previously, so value added has not really diminished. Output of building development is now circulated through building construction, i.e. it has been added as an equal amount to the output and intermediate consumption of building construction starting from 1975. This did not alter the value added of building construction.
Expenditure of site preparation related to building construction has previously been entered as intermediate consumption, consumption of fixed capital and compensation of employees of building construction. Now it is entered in full under building construction as intermediate consumption purchased from civil engineering. This increases intermediate consumption of building construction, as well as output and intermediate consumption of civil engineering. In civil engineering, the old level of 1995 has been adhered to.
All in all, value added of building construction grew by about 10 per cent compared to previous data, at most by over 15 per cent, or nearly EUR 1 billion.
Trade
Especially calculations for the 2005-2007 period have been revised in trade. In the sale of motor vehicles and in other retail trade sales output and intermediate consumption have been increased but the impact on value added is minor. Items not belonging to it were deducted from the output of wholesale trade, which reduced value added of wholesale trade by about EUR 1 billion. The changes in output have been interpreted as changes in prices (trade margin) rather than in volume.
All in all, value added of trade decreases by about EUR 1 billion, or around 6-7 per cent, in 2006-2007 when compared to the previous data. The level differential has been gradually taken backwards so that the old level of 1995 has been adhered to.
Transport
In freight transport by road subcontracting expenditure has been added to intermediate consumption from which it was previously erroneously deducted. In consequence of this value added of the activity falls by over EUR 1 billion at most starting from 2005. Recording of output and intermediate consumption on the gross principle has been introduced in water transport and especially in supporting and auxiliary transport activities, which increases them considerably but the impact on value added is minor. Gross recording has also been used in telecommunications, but at the same time intermediate consumption has been adjusted by adding to it items that were previously missing from it. In consequence of this value added of the activity has fallen by over EUR 1 billion at most starting from 2005. Revisions have also been made to calculations concerning other transport activities but their impacts are not very large.
All in all, value added of transport decreased by around EUR 3 billion, or 20 per cent, in 2006-2007 when compared to the previous figures. All economic activities considered, this is clearly the largest level revision of value added.
The level differential has been carried backwards so that in other land transport, water transport, auxiliary transport activities and telecommunications the old level of 1985 has been adhered to and the level differential of output and intermediate consumption has gradually been adjusted backwards to it from 2005. In the activities of rail transport, transport via pipelines and air transport the old 1995 level has been adhered to.
In consequence of this, in some years the annual change of value added deviates by several percentage points from old figures in certain transport activities. All in all, the average annual growth in the volume of value added of transport fell from 4.2 per cent to 3.5 per cent in the 1985-2008 period.
Financial intermediation and insurance
In the output of financial intermediation activities, output of financial intermediation services indirectly measured was reviewed starting from 1985 because the calculation method concerning exported financial intermediation services indirectly measured has been revised (see section on financial intermediation services indirectly measured). The price index of financial intermediation services indirectly measured has also been reviewed, in consequence of which the volume change of value added deviates considerably from previous estimates in certain years (especially in 2005 and 2006).
"Other expenditure" included in the source data (Virati) has been deducted from intermediate consumption because it is not viewed as fully belonging to intermediate consumption as defined in national accounts. A respective revision has also been made to the intermediate consumption of insurance activities. The old level of 1995 has been adhered to in financial intermediation activities and the level of 1999 in insurance activities.
Real estate activities
Output (imputed rents) of owner-occupied dwellings has been reduced starting from 1991 mainly due to re-estimated rents of owner-occupied detached houses. Intermediate consumption has been reduced even more because, among other things, the distribution of annual repairs between dwellings and other buildings was reviewed and the waste management of owner-occupied detached houses was moved under private final consumption.
Output (i.e. rents) and intermediate consumption of rental dwellings was revised slightly upwards starting from 1996, because the stock of rental dwellings was estimated to be larger than before. At the same time, the distribution of ownership of rental dwellings by sector has been revised, the share of households has grown and those of non-financial corporations and housing corporations have decreased.
Rent income of housing corporations and housing companies from business and other premises has been added to the output of the activity of ownership and letting of dwellings starting from 1990. This income was previously not included in the calculations.
All in all, value added of the activity of ownership and letting of dwellings is hundreds of millions of euros higher than previously.
Output and intermediate consumption of building development have been reduced considerably from 1975 onwards due to a methodological revision (see section on construction and building development). Output of letting of real estate has been increased starting from 1997 and output of real estate activities on a fee or contract basis has been revised slightly downwards starting from 1996. Among the reasons for this are shifts in activity.
Other services
The output and intermediate consumption of other business activities have been increased in the 2000s. Data by establishment, which were not previously available in this format, have been used in calculations concerning this activity. The old level of year 2000 has been adhered to.
Reclaimed amounts of subsistence allowances granted by local government have previously been erroneously treated as market output of social services. Correct treatment deducts them from granted subsistence allowances (social benefits). The error has been corrected starting from 1997.
An estimate for prostitution has been added to other personal service activities starting from 1991.
The distribution of other subsidies on production (than product subsidies) between activities has been altered starting from 1986 because new information has been obtained about it from e.g. the Finnish Funding Agency for Technology and Innovation and the Ministry of Employment and the Economy.
Hidden economy
New estimates have been made about the hidden economy on the basis of a separate study. This has affected output, intermediate consumption, wages and salaries, and operating surplus/mixed income in many economic activities. Hidden economy comprises both informal grey economy and illegal economy (prostitution, narcotics, smuggling).
Grey output and value added have been increased especially in servicing and repair of motor vehicles, and in hotel and particularly in restaurant activities.
Financial intermediation services indirectly measured (FISIM)
The calculation method used for financial intermediation services indirectly measured has been revised in compliance with Eurostat's latest guidelines. In exports and imports FISIM between financial corporations have been set at zero. This has altered significantly the exports and imports of financial intermediation services indirectly measured, so that they are no longer negative in any one year. The methodological revision also affects the output of FISIM because exports is a component in output calculations.
Because of the altered imports the use of financial intermediation services indirectly measured as an intermediate product in the sector of non-financial corporations also changed. The distribution by activity was revised within the sector of non-financial corporations on the basis of data on e.g. credit stock, in consequence of which intermediate consumption and value added became slightly revised in almost all activities.
The price indices of FISIM have also been revised starting from 1985, in some years by several percentage points.
The revision of FISIM also caused revisions to interest income and expenditure in the sector accounts.
Wages and salaries and labour input
Profit bonuses paid by non-financial corporations to their personnel funds have been added to wages and salaries starting from 1990. Other minor revisions have also been made to wages and salaries.
Numbers of persons employed and hours worked have been reviewed in some economic activities. The number of self-employed persons in social services has been reduced from 1994 onwards because the decrease in private family daycare in the 1990s had not been previously allowed for. The number of persons employed has been increased in, among others, trade, telecommunications and business activities. All in all, the number of persons employed has decreased from previous figures by a couple of thousands in the 2000s.
Exports and imports
Several revisions were made to the exports and imports of goods. The so-called exchange rate adjustment was discontinued as of 1999 because it had lost its meaning due to the introduction of the euro. Returned goods were added for the years 1995 to 2004 because they had been missing from the figures of the customs.
Imports of vehicles from abroad by private persons has been added to the imports of goods starting from the year 2000. Smuggling (alcohol, tobacco and narcotics) and goods acquired by the transport stock from abroad have been reviewed starting from 1990. Goods transport has been adjusted in respect of motor vehicles in several years, which also affected exports of services. In the new calculations, assembly of motor vehicles in Finland has been treated in demand more consistently than before as goods export.
The customs have conducted a new study about cif and fob in sea freight in 2008. On the basis of the study the freight and insurance costs relating to the imports of goods were raised starting from 2007, which lowered goods imports, which are valued on fob basis in national accounts. The item was moved mostly to the imports of services according to the shares of non-domestic shipping companies and insurers.
The level of imports of services was raised gradually in 1996-2000 and lowered in 2001. This way the import figures for research and development and other business activities which had already previously been raised starting from 2000 were retrospectively taken into account. Exports and imports of financial intermediation services indirectly measured (FISIM) also became revised (see section on financial intermediation services indirectly measured).
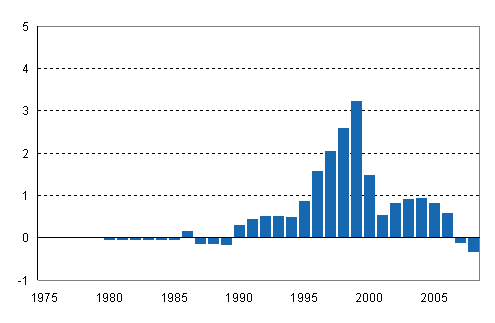
All in all, the value of exports altered most in 1991, when it fell by around two per cent (FISIM) while the value of imports changed most in 1999 when it grew by about three per cent (imports of services). The balance for goods and services weakened, at most by good EUR 1 billion in 1999.
Consumption expenditure
New data concerning households' consumption expenditure became available from the 2006 Household Budget Survey. Because the results of the previous Household Budget Survey (2001) have already been taken into consideration earlier, the corrections concerned the years 2002-2006. The corrections were used to determine changes in the consumption of products over time and to increase the precision of the structure of consumption between product groups.
For example, expenditure on food, furniture and domestic appliances, repair and servicing of motor vehicles, and social services contracted slightly. By contrast, expenditure on medicines, recreation and culture, and restaurants and hotels increased.
Housing expenditure, among other things imputed rents of owner-occupied dwellings, has been revised to comply with the new output calculations for the activity starting from 1991. On the basis of the Household Budget Survey, expenditure on water and waste, and other services related to housing have been revised upwards starting from 1975, and electricity and other energy consumption starting from 1990.
Expenditure on bus journeys was revised downwards starting from 1996 to make it more consistent with the adjustments already made earlier to product subsidies in transport. Narcotics have been estimated into consumption expenditure starting from 1990, they were previously not included at all. Consumption expenditure of resident households in the rest of the world has been revised for 1995-2002 to correspond with the old supply and use tables.
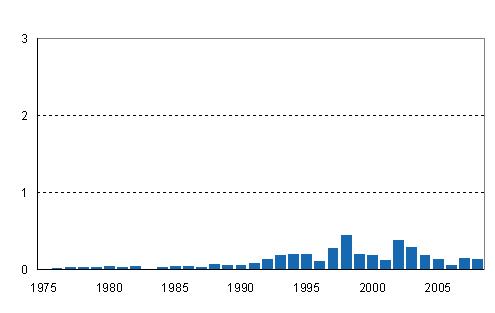
All in all, households' consumption expenditure changed fairly little, it grew at most by half-a-per cent, or good EUR 200 million in 1995.
Consumption expenditure by government grew at most by one per cent, or around EUR 300 million in the early 2000s. The main reason was that local government's consumption expenditure had previously been recorded erroneously.
Investments
Investments in building construction, especially in residential buildings, have been increased starting from 1991 because of re-evaluation of the level of newbuilding (see section on construction and building development). The increases mainly concern investments of the household sector.
Other investments in building construction have been increased starting from 2003 and decreased in 1995-2001. Building construction investments of agriculture have been decreased starting from 1996 because trotting horse stables and the like do not belong to agriculture. Investments of real estate letting activity have also been reviewed.
In civil engineering, investments in telecommunications have been revised downwards starting from 2003.
Investments in machinery, equipment and transport equipment have been reviewed against data in statistics on the finances of agricultural and forestry enterprises starting from 1999. Investments in machinery and stock by transport and some other activities have also been revised especially in the balancing of supply and use tables for 2003-2006. The prices of computers and telecommunication equipment included in investments in machinery and equipment have been reviewed starting from 1990.
The level of investments in software has been lowered because new data have been obtained from certain source statistics, such as structural statistics. Investments in software have been separately inquired about in the source statistics since 2006. In central and local government, and in non-profit institutions serving households the new lower levels have been chained back as far as the year 1975. In financial and insurance corporations the old 1995 level has been adhered to and the level differential has been gradually closed to it. In the non-financial corporations sector, however, the level of investments in software has risen slightly in the 1997-2003 period and fallen prior to it. The distribution by activity has also been reviewed.
The price development of software investments has been reviewed starting from 1975. Previously, prices were assumed to rise continuously but according to a new assessment the prices of software investments have fallen somewhat in the long term.
In major land improvement investments, agriculture's investments have been increased starting from 1995 and the figures for forestry starting from 2003 due to the availability of new data sources. Ownership transfer costs of land have been increased starting from 1999 and the investments have been moved from forestry to the ownership of dwellings because such transfer costs mostly arise from the sales of dwelling plots (agency fee and asset transfer tax).
All in all, investments increased considerably when compared to the previous data starting from the year 1993. At best the growth amounted to some 6 per cent, or nearly EUR 2 billion, in 2004-2005. In practice the growth comes from investments in residential buildings.
The revisions of the figures on investments also caused changes to consumption of fixed capital.
Sector accounts
All aforementioned revisions have also caused changes to sector accounts and affected, for instance, disposable income and net lending of the sectors.
One major classification revision has been made in the sector accounts. The State Pension Fund has been moved from the central government sector to the sector of employment pension schemes starting from the year of its establishment, i.e. 1990. According to the new treatment the central government and its employees pay their employment pension contributions to the sector of employment pension schemes, which receives returns from investing them and enters its assets as income transfer to central government. The central government continues to pay the pensions. The revision weakens the net lending of central government and strengthens that of employment pension schemes by some EUR 2 billion at most but has no bearing on the net lending of general government.
Households' disposable income grew by a few hundreds of millions of euros mainly due to the grown operating surplus from building construction and ownership of dwellings. By contrast, their net lending weakened due to grown investments in residential buildings, at most by some one-and-a-half billion euros.
The financial position of the non-financial corporations sector weakened due to the diminished operating surplus, at most by around EUR 1 billion. The net lending of the sector rest of the world improved because Finland's current account weakened.
Figures
GDP annual volume change %
GDP revision %
Consumption revision %
Imports revision %
Exports revision %
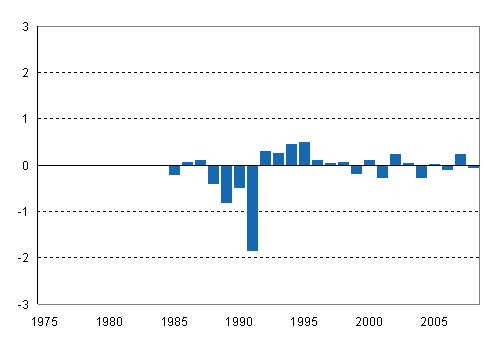
Investments revision %
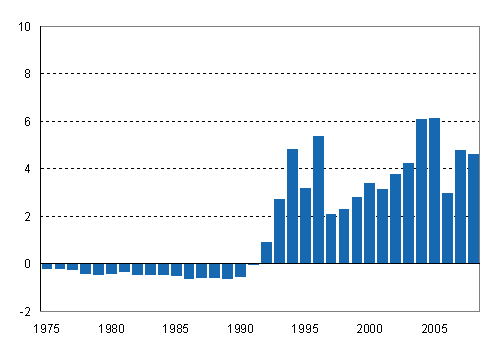
Last updated 5.2.2010
Official Statistics of Finland (OSF):
Annual national accounts [e-publication].
ISSN=1798-0623. 2008,
Revision of national accounts time series 2010
. Helsinki: Statistics Finland [referred: 3.4.2025].
Access method: http://stat.fi/til/vtp/2008/vtp_2008_2010-01-29_men_001_en.html

