Published: 16 March 2016
Gross domestic product grew by 0.5 per cent last year
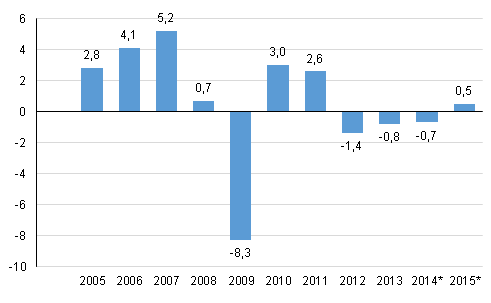
According to Statistics Finland’s preliminary data, the volume of Finland’s GDP grew by 0.5 per cent in 2015. The growth rate became slightly revised from the data on quarterly national accounts published at the end of February (was 0.4 per cent). Last year, GDP that describes the output of the national economy stood at EUR 207 billion. National income describing the income of the national economy went up by 1.6 per cent in real terms.
Annual change in the volume of gross domestic product, per cent

Total manufacturing contracted by 0.6 per cent. Value added fell most in the manufacture of electrical and electronics industry, by 2.6 per cent. Service industries grew as a whole by 0.9 per cent. Private services grew by 1.8 per cent but public services decreased by 1.1 per cent. Growth was biggest in information and communication activities, 4.9 per cent and in financial and insurance activities, 3.8 per cent.
Despite the slight growth in production, the demand of the national economy decreased by 0.4 per cent last year. Demand was depressed by lower investments, public consumption and inventories. Investments decreased by 1.1 per cent. Public consumption contracted by 0.9 per cent but the volume of private consumption went up by 1.4 per cent. The volume of exports grew by 0.6 per cent and that of imports fell by 0.4 per cent.
Non-financial corporations' operating surplus describing profits from their actual operations contracted by one per cent. By contrast, entrepreneurial income that describes the profit before payment of taxes and dividends grew by four per cent. It is estimated that non-financial corporations paid eight per cent less dividends and 14 per cent more direct taxes than in the year before. Non-financial corporations' financial position showed a surplus of EUR 9.2 billion. The financial position improved thanks to a reduction in inventories.
The financial position of financial and insurance corporations showed a surplus of EUR 0.5 billion. Financial corporations’ commission income grew by four per cent but interest income (financial intermediation services indirectly measured) remained almost unchanged.
General government deficit 2.7 per cent of GDP
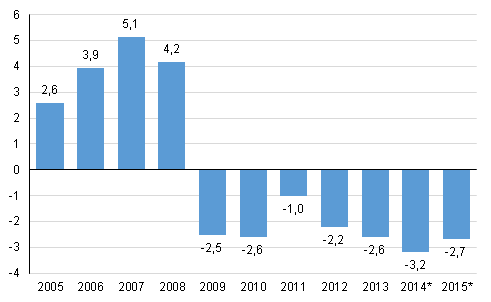
The financial position of general government, i.e. net lending, was in deficit for the seventh successive year, EUR 5.7 billion. In the previous year, the deficit was EUR 6.5 billion. The deficit was 2.7 per cent relative to GDP, which was below the three per cent reference value of the European Union unlike in 2014. Statistics Finland will publish the deficit and debt data that must be reported to the European Commission on 31 March 2016. The deficit data published here may become revised in that connection.
General government surplus / deficit relative to GDP, per cent

The deficit of central government was EUR 6.3 billion, while one year before it was EUR 7.7 billion. One of the reasons for the contraction of the deficit was a 1.7 per cent growth in tax revenues. The deficit or net borrowing of local government (municipalities and joint municipal authorities, etc.) contracted to EUR 1.4 billion according to preliminary data, having been EUR 1.6 billion in the year before.
The surplus of employment pension funds decreased from EUR 3.4 billion to EUR 2.9 billion. The State Pension Fund’s higher than usual income recognition to the state lowered the deficit. The surplus does not include holding gains in assets. Other social security funds were EUR 0.8 billion in deficit mainly due to increased unemployment expenses.
General government's share of the gross value added was 20.7 per cent in 2015, which was 0.1 percentage points lower than in 2014.
Households’ real income grew by one per cent
Households’ real income grew by one per cent. Households' adjusted real income grew by 0.6 per cent. Adjusted income also takes into consideration welfare services, i.e. the individual services that general government and organisations produce for households, such as educational, health and social services.
Wage and salary income grew by 0.8 per cent in nominal terms. Social security benefits went up by 3.2 per cent, as the number of pensioners and unemployed increased. By contrast, property income and entrepreneurial income decreased by 0.1 per cent.
Direct taxes paid by households and compulsory social security contributions increased by 2.1 per cent. In nominal terms, final consumption expenditure grew by 1.8 per cent but investments, mainly in dwelling, decreased by 0.8 per cent.
Source: National Accounts 2015, preliminary data. Statistics Finland
Inquiries: Olli Savela 029 551 3316, Tuomas Rothovius 029 551 3360, kansantalous@stat.fi
Director in charge: Ville Vertanen
Publication in pdf-format (318.1 kB)
- Reviews
- Tables
-
Tables in databases
Pick the data you need into tables, view the data as graphs, or download the data for your use.
Appendix tables
Updated 16.3.2016
Official Statistics of Finland (OSF):
Annual national accounts [e-publication].
ISSN=1798-0623. 2015. Helsinki: Statistics Finland [referred: 19.4.2025].
Access method: http://stat.fi/til/vtp/2015/vtp_2015_2016-03-16_tie_001_en.html

