Published: 16 December 2016
Service industries generated most operating profit in 2015
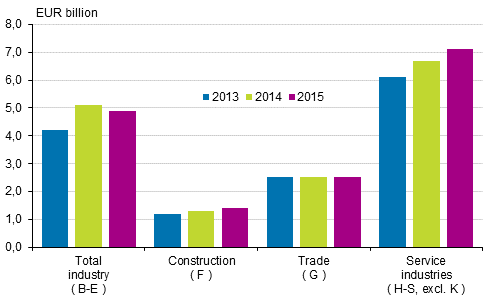
Enterprises in manufacturing, construction, trade and service industries generated a total of EUR 378.5 billion in turnover in 2015. Turnover decreased by EUR 5.2 billion from the previous year. Enterprises’ operating profit amounted to EUR 15.8 billion of which enterprises in service industries represented EUR 7.1 billion. Operating profit in manufacturing was only EUR 4.9 billion due to a negative operating result in the manufacture of communications equipment. These data derive from Statistics Finland's structural business and financial statement statistics for 2015.
Enterprises' operating profit in 2013 to 2014

Turnover in all manufacturing was EUR 140.7 billion in 2015. One year before, the turnover amounted to EUR 147.5 billion. Turnover development was considerably influenced by business reorganisations of large enterprises in the electronics industry and in manufacturing of basic metals. In the electronics industry, turnover declined by EUR 6.6 billion and in the manufacturing of basic metals it grew by EUR 3.1 billion.
In the electronics industry, the nearly EUR two billion negative operating result from the manufacture of communications equipment had a decreasing effect on the operating result of the entire industry. The operating margin in all manufacturing remained on level with the previous year and was 3.4 per cent of profits.
The turnover of service industries was EUR 93.4 billion in 2015. Turnover grew by EUR three billion or 3.3 per cent year-on-year. Among service industries, the IT sector continued to grow heavily by EUR 1.3 billion from 2014. The games industry covered EUR 0.8 billion of the growth. The total operating profit of services industries grew by EUR 0.4 billion from the year before. The games industry managed to raise its operating profit by nearly EUR 0.4 billion.
The data are based on the Tax Administration's business taxation data. The data have been supplemented with Statistics Finland's own inquiry.
Number of personnel of enterprises continued declining in 2015
During 2015, there were 365,051 enterprises operating in Finland, which was around 3,500 fewer enterprises than in 2014. The number of enterprises decreased in the industries of manufacturing (industries B–E), construction (F) and trade (G). The number of industries grew by around one per cent in service industries. If enterprises in primary production industries A are excluded, the number of enterprises increased by slightly under one thousand.
A majority of enterprises are own-account workers whose share was slightly over 45 per cent in 2015 even though their share decreased. The share of limited companies continued to grow and was around 39 per cent. The share of general and limited partnerships continued to decline.
The number of personnel developed in tune with the number of enterprises. In 2015, a total of 1,423,306 persons worked in enterprises as wage or salary earners or entrepreneurs, which was 10,760 fewer than in 2014. The number of personnel decreased in the industries of manufacturing, construction and trade but increased by 0.9 per cent in service industries.
Fifty-three per cent of enterprises’ personnel worked in group enterprises. The share of group enterprises in personnel grew slightly from one year back. Even though a majority of the personnel works in group enterprises only slightly under 4.5 per cent of enterprises belonged to a group in 2015.
The total number of personnel grew in enterprises with 20 to 499 employees. The total number of personnel in enterprises with zero to four employees has been declining at least since 2013. The total number of personnel in enterprises that employ over 500 persons has also decreased over the corresponding period.
Source: Statistics Finland
Inquiries: Pirkko Nurmela 029 551 3519, Jyri Järvinen 029 551 3562, rakenne.tilastot@stat.fi
Director in charge: Mari Ylä-Jarkko
Publication in pdf-format (215.1 kB)
- Tables
-
Tables in databases
Pick the data you need into tables, view the data as graphs, or download the data for your use.
Appendix tables
- Revisions in these statistics
-
- Revisions in these statistics (16.12.2016)
Updated 16.12.2016
Official Statistics of Finland (OSF):
Structural business and financial statement statistics [e-publication].
ISSN=2342-6233. 2015. Helsinki: Statistics Finland [referred: 19.4.2025].
Access method: http://stat.fi/til/yrti/2015/yrti_2015_2016-12-16_tie_001_en.html

